IoT party: installing InfluxDB (+Grafana) on a Raspberry PI for IoT sensors
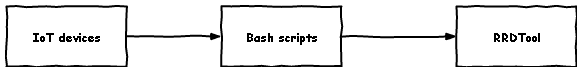
Last year I upgraded my solar water panels with some temperature probes, and I scattered NodeMCU in my house (with some DHT22 and DHT11 sensors). At the time I had an old PC that was acting as a server: IoT devices were sending readings to RabbitMQ instance on that server, with a shell script that was bridging between MQTT and RRDTool database.
Of course, for me that was perfect. But I when I tried to share these tools with my family, quickly became clear that I had to make a nice interface. I ended up by sending the chart by Telegram with a bot.
Then, during last month, the old server died. I moved some things to the cloud, and some other things were archived. After some free-time during cleanup (I had two 1TB disks to cleanup...) I landed into Grafana home page. And I decided to give it a try.
Architecture

Using MQTT will improve the reliability and efficency of IoT devices that I'm going to (re)use((How? Because MQTT is lightweight, energy efficient and async)).
NTP: time is money!
The Time-Series database that we'll use rely on system clock. To keep the RPi clock in sync, we need to install a NTP client:
apt-get install ntpInstalling RabbitMQ
As I'm using Raspbian for RPi, I just need to download the *.deb package from RabbitMQ webpage and install it (as root):
wget https://github.com/rabbitmq/rabbitmq-server/releases/download/rabbitmq_v3_6_12/rabbitmq-server_3.6.12-1_all.deb
dpkg -i rabbitmq-server_3.6.12-1_all.deb
Most likely we don't have Erlang installed on RPi, so we may fix the "missing dependency error" by issuing:
apt-get install -fConfiguring RabbitMQ
First of all, we need to enable two plugins that we're going to use: the MQTT plugin, and the Management Interface plugin (for web management):
rabbitmq-plugins enable rabbitmq_mqtt
rabbitmq-plugins enable rabbitmq_management
This will install the web interface on port 15672. For security reasons (we don't want to end up with another MongoDB effect, do we?), the management interface default login (guest/guest) is available only on localhost. As we are in a headless RPi, we can use SSH for that:
ssh ip.address.of.raspberrypi -l pi -L15672:127.0.0.1:15672Now you can browse (on the PC where was launched SSH client) http://localhost:15672/ and login with guest/guest. Go to "admin" section and create an user. Remember to set the user permissions. Now you can browse the RabbitMQ management interface with your PC (http://ip.address.of.raspberrypi:15672/).
Installing InfluxDB
As a backend for Grafana I'm using InfluxDB, a Time-Series database. You can download latest InfluxDB version on official website:
wget https://dl.influxdata.com/influxdb/releases/influxdb-1.3.5_linux_armhf.tar.gz
tar xvfz influxdb-1.3.5_linux_armhf.tar.gz
mv influxdb-1.3.5-1 /opt/influxdb
To start InfluxDB with RPi, we need to create a systemd unit file.
cat > /etc/systemd/system/influxdb.service <[Service]
ExecStart=/opt/influxdb/usr/bin/influxd run
Restart=on-failure
User=root
Group=root
[Install]
WantedBy=multi-user.target
EOF
We can save this file to /etc/systemd/system/influxdb.service, and update systemd:
systemctl enable influxdb.service
systemctl start influxdb.service
Installing Grafana
We need NodeJS for Grafana Grunt assets. We can use the official way:
curl -sL https://deb.nodesource.com/setup_6.x | sudo -E bash -
apt-get install nodejs
Then, we can install Grafana from @fg2it pre-builds (as the build process take too much memory and hours):
wget https://github.com/fg2it/grafana-on-raspberry/releases/download/v4.4.3/grafana_4.4.3_armhf.deb
dpkg -i grafana_4.4.3_armhf.deb
systemctl daemon-reload
systemctl enable grafana-server
systemctl start grafana-server
That's it!
Configuring Grafana
Grafana has a wizard for initial configuration (in this case you'll need to point to the InfluxDB instance): you can simply browse to http://ip.address.of.rpi:3000/
The bridge between MQTT and InfluxDB
As Telegraf (the "default" bridge between InfluxDB and MQTT) is heavy and rely on a fixed scheme for MQTT payloads (eg. the probe MQTT message should be formatted as one of the "supported payload format"), I wrote a bridge that parse the format that I'm using for sensors, and make the right HTTP requests to write into InfluxDB. This is an example:
import requests
import pika
def _listencallback(ch, method, properties, body):
if method.routing_key == ‘internaltemp’ or method.routing_key == ’externaltemp’:
# … extract some values from payload …
r = requests.post(“http://127.0.0.1:8086/write?db=influxdbname”,
data=“myserie temperature=%s,humidity=%s %s000000000”
% (temperature, humidity, unixtimestamp))
if r.status_code > 299:
print “Request error: %d %s” % (r.status_code, r.reason)
else:
print “Request OK”
Connect
credentials = pika.PlainCredentials(‘user’, ‘pass’)
connection = pika.BlockingConnection(pika.ConnectionParameters(‘127.0.0.1’, 5672, “/”, credentials))
channel = connection.channel()
channel.exchange_declare(exchange=‘amq.topic’,exchange_type=‘topic’,durable=True)
result = channel.queue_declare(exclusive=True)
channel.queue_bind(exchange=‘amq.topic’, queue=result.method.queue, routing_key=“internaltemp”)
channel.queue_bind(exchange=‘amq.topic’, queue=result.method.queue, routing_key=“externaltemp”)
channel.basic_consume(_listencallback, queue=result.method.queue, no_ack=True)
channel.start_consuming()
Happy coding!